Right time for Global Masters Fund
The ASX produces factual information on the Australian Listed Investment Company (LIC) sector. LICs must report their NTA to the ASX by the 14th of each month and the ASX provides a sector update1 soon after.
Industry researchers also produce LIC analysis, looking to present trends and opportunities to their clients. These include Independent Investment research-IIR and stockbrokers Baillieu Holst and Bell Potter who produce unique content about those LICs they cover.
Internal and External LIC comparisons are difficult
While the analysis is high quality and insightful there are limitations. Amongst these is that observing LICs can be akin to watching a horse or rowing race where a glance at rowboats mid-stroke or horses mid-stride would appear different just moments later. A brief glance would make it difficult to know who is leading the race.

For instance, many LIC NTAs are reported monthly and some more frequently, while the share prices are updated daily. The researcher may be looking at an LIC’s share price on 10th of January while referring to that LICs last published NTA of the 30th of November – nearly 6 weeks old. This means that referencing an LIC’s share price to its own last reported NTA can be problematic. [Some LICs such as GFL make effort to get their monthly NTA out as soon as possible each month]
Another issue is comparison between LICs, when a researchers’ early January LIC update compares some LICs who have released their 31 December NTA to other LICs who have not reported an update to their 30 November NTA – and as we know markets can move a lot in that time. To overcome this problem and enable some basic comparison between LICs some researchers look at the positions inside LIC portfolios to calculate an approximate NTA that has captured probable portfolio moves during the month. While this is not perfect, backward-looking analysis has shown they have been quite good with their NTA tracking and they are producing reasonably accurate comparison tables.
Another limitation is the time-decay aspect of published NTAs in periods where there are some large daily swings in LIC share prices- sometimes 5% or more- so comparing apples and apples between LICs with NTA dates up to 6 weeks different is tricky, especially when markets have a strong month.
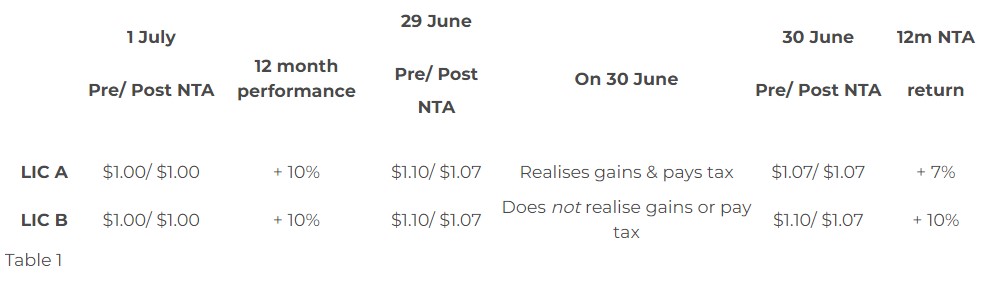
Finally consider that LICs pay tax at different times and that most comparison tables do not capture this. In Table 1 we can see that 2 identical (hypothetical) LICs that produced an after costs and fees return of 10% during a 12 month period will show different NTA returns for the year if one were to elect to realise gains and pay tax and the other did not.
The summary of all this is that because the data is not always comparable it is difficult to compare LICs at any specific moment in time, and unlike Horse or Rowing races there is no set finish line
Understanding what Discounts and Premiums really mean
The comparison of LIC Share Prices to their own NTA- the “discount and premium”- is something volumes have been written on. Surprisingly little of that refers to the actual point of why it is measured, which is to show whether an LIC presents an opportunity or has been overbought.
Consider 2 hypothetical LICs A and B as shown in the table below. Starting at a $1.00 NTA, LIC A generated an NTA return of negative 10%pa over its first 3 years but its share price only fell by -5%pa and so it is at a Premium… which is apparently good. LIC B generated an NTA of +10%pa over that 3 years, but its share price only rose +5% pa and so it is trading at discount…which is apparently bad.
A simplistic table of this appears as such:
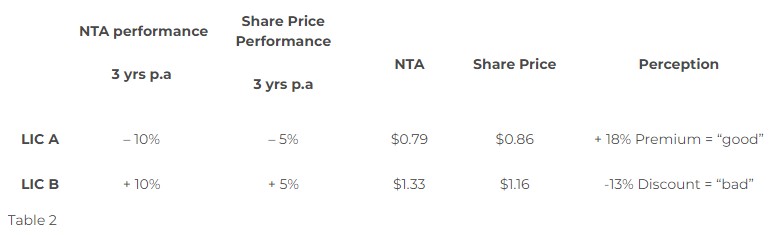
It doesn’t take a rocket scientist to see which LIC is the better performer and it is disappointing that so much emphasis is placed on the Premium and Discount column because looking at it in isolation is not just meaningless, it is deceptive!
The outcome is that people are being conditioned to pay less for better performance. Further, directors of strongly performing LICs are quizzed about discounts at AGMs and field questions about winding up or suggestions to liquidate part of the portfolio (to temporarily boost its share price through a buy back). A person from another planet observing the LIC market for the first time would be quite confused at where the emphasis is placed in the LIC research sector.
Across the volumes of commentary on LICs the actual NTA performance is inadequately discussed and often consigned to one of many columns in a hard to read table. This is disappointing because NTA performance gives a strong indication of the managers’ ability to continue to drive share price returns and should be the key metric used to evaluate an LIC.
A change is happening in the conversation
For possibly the first time, LICs researchers are giving strong consideration to the idea of changing the way they discuss discounts and premiums- at least for a short period. These ideas range from not talking about them to referring to them as a cent-per-share “differential potential”, to simply removing emphasis and columns from their tables.
The truth is that researchers don’t even need to write about them or add columns and pages. In the main, LIC Investors are mathematically literate and can work out an X/Y formula to determine where an LICs share price sits relative to its NTA.
The idea of this change-up is to test whether researchers have been talking about premiums and discounts because people want to know about them, or, if people are talking about them because researchers keep writing about them and inflate their relevance? If there is a feedback loop, will severing that redirect investor’s attention toward performance (and by extension will the correction in perception be sufficient to bring share prices and NTAs closer together.
Granted this is a big step for the industry, but if even some attempt is undertaken observers can for the first time test to monitor for stock and sector wide shifts in share prices. By that, will investors be prepared to pay a more appropriate (higher) price to purchase strong performing LICs future performance?
It would be interesting to see, for the first time how much has been a self-fulfilling/ chicken and egg dynamic? Do discounts exist for any viable reason or have sellers been conditioned that they have to sell at lower price than they should because they exist? Time will tell whether the industry can take this step and if they do whether the “line” shifts.
Will this correct size bias?
LIC research shows that there is a bias against LICs based on factors not related to performance. Both Charts 1 & 2 very clearly show that smaller sized LICs have a deeper discount than larger sized LICs.
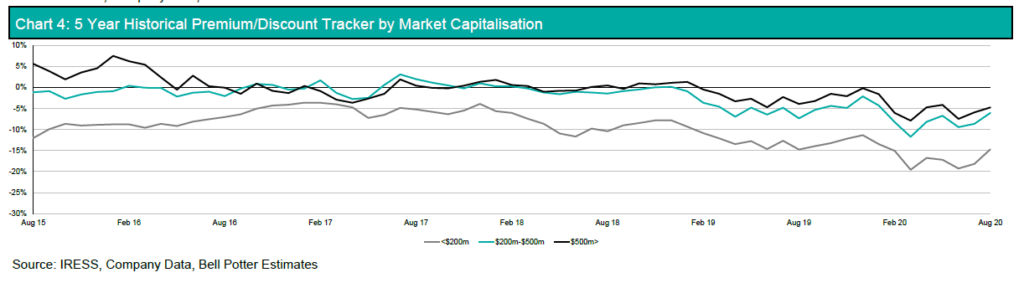
Chart 1. Source: Bell Potter Limited
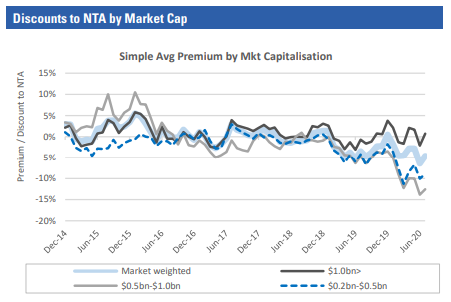
Chart 2. Source: IIR
This exists because of pre-conceived prejudice where performance is insufficiently considered. An article published in the November Flagship Investments newsletter shows that the table topping LICs include some of the smallest ones – so it is not smaller fund size that is a cause for discount.
One argument as to why smaller sized LICs are marked harder includes something referred to as a liquidity penalty, however for the average LIC investor with $10,000 or $20,000 there is a deep enough market in almost all LICs for patient shareholders to sell, and buy, at a realistic share price.
Patience
The key word in the conversation about realising value is patience and as warren Buffet says “The stock market is a device for transferring money from the impatient to the patient”. Perhaps the dialogue with LICs may shift to being about historic performance, the opportunity available and that investors should be prepared to pay to buy future performance?
Catching the tailwinds
The key is- unsurprisingly- to know your LIC. By that what has its underlying performance been, and are you able to buy that performance at a fair price?
Savvy investors aware of this can make further use of data produced by LIC researchers. One such opportunity is to catch the tailwind of changes in market sentiment shifts in the LIC space. While we might argue over the gap between the lines in Charts 1 and 2 we can see they do move in a wave.
Chart 3 (below) is produced by Bell Potter and smooths data to remove that noise of daily, weekly and monthly fluctuations in individual LICs, by looking at a 6 month moving average of their discounts. As we can see in the dotted line of International LICs, collectively their discounts are deeper than they have been for many years, and seem to have turned.
Notwithstanding how individual LICs perform on an NTA and a share price basis, this chart suggests that patient investors in good LICs, sitting on some dormant value, could be ready to catch a few years of sector-wide tailwind to add some extra alpha to their individual performance.
Some research and discipline, together with good timing could see patient investors well rewarded in the choice of well-performing International focussed LIC.
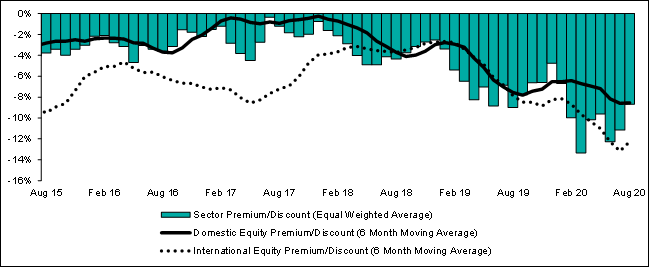
Chart 3: Premium/Discount in LICS tracked by Bell Potter
Notes: https://www2.asx.com.au/issuers/investment-products/asx-funds-statistics
This article is provided for education purposes only and should not be considered as financial advice. Please consult professional advice before making any investment decisions.
Global Masters Fund Limited is a unique ASX-listed invested company with principal investments in Berkshire Hathaway in the US and other Global Investments.