The Global Masters Fund (ASX: GFL) announced on the 4th of June that both its NTA and Share Price were at all-time month-end highs, at $3.01 and $2.30 cents per share respectively.
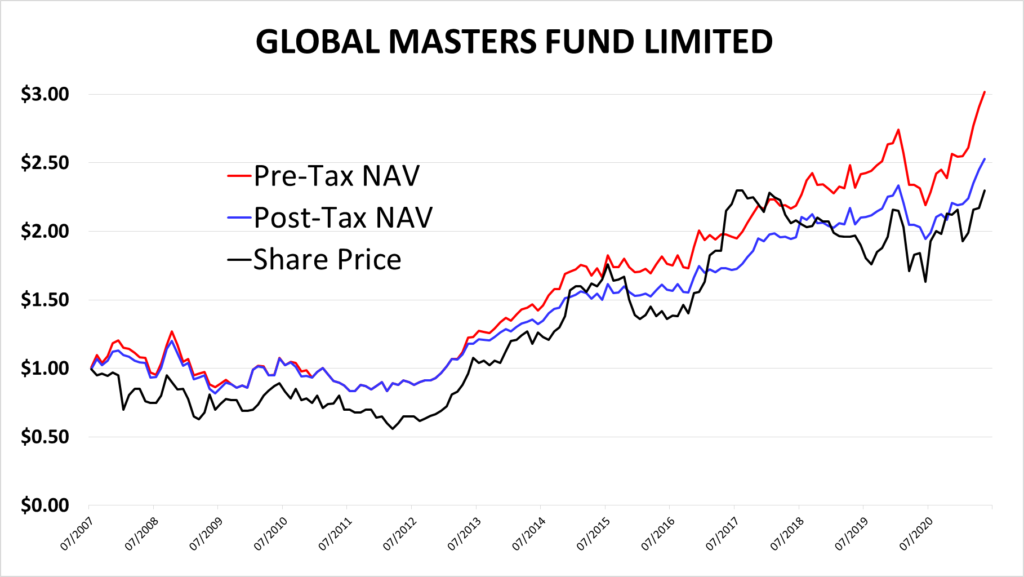
Chart 1: Global Master Fund Ltd NTA and Share Price. Source InvComs
Since the temporary retreat following market dislocation from Covid-19, the GFL share price has risen 41% and the NTA by 38% to these all-time heights. Notwithstanding its recent growth, the share price still represents potential value for shareholders. This follows the general trend in smaller-sized LICs that after years of widening, this trend appears to be reversing and their discounts are now narrowing.
This is shown in the chart produced by Bell Potter which measures Historical Premium/Discount Tracker by Market Capitalisation. As can be seen, while smaller-sized LICs discounts have narrowed they are still currently deeper than their historic averages and represent upside potential for investors.
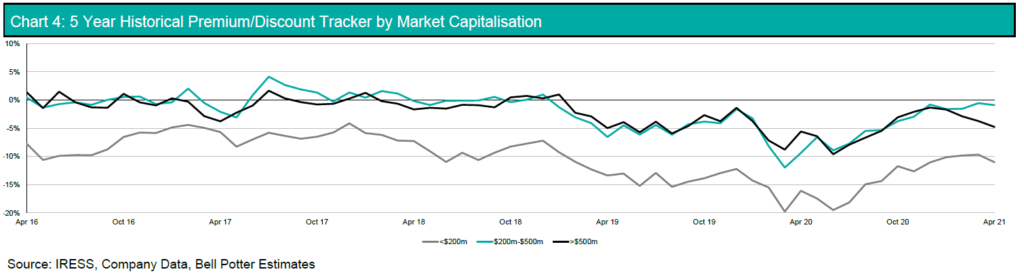
Chart 2: Source Bell Potter. 5 Year Historical Premium/Discount Tracker by Market Capitalisation
With continued NTA growth, the GFL Share Price should continue to rise and be a beneficiary of its own strong performance and the small LIC discount narrowing as the company grows.
Another tailwind for GFL
Another tailwind that some LICs may soon benefit from are changes to the way LIC researchers address performance.
These researchers have done an exceptional job covering LICs. One limitation however is that in an effort to produce comprehensive reports full of helpful data, too much ended up being written about Discounts as though they are a bad thing or a sign of poor performance, which might not necessarily be the case. The truth is that in a strong performing LIC a discount should represent an opportunity.
Understanding what Discounts and Premiums really mean
Consider 2 hypothetical LICs as shown in the table below. Starting at a $1.00 NTA, LIC A generated an NTA return of negative 10%pa over its first 3 years but its share price only fell by -5%pa and so it is at a Premium. LIC B generated an NTA of +10%pa over that 3 years, but its share price only rose +5% pa and so it is trading at discount.
A simplistic table of this appears as such:
NTA performance 3 yrs p.a | Share Price Performance 3 yrs p.a | NTA | Share Price | Perception | |
| LIC A | – 10% | – 5% | $0.79 | $0.86 | + 18% Premium = “good” |
| LIC B | + 10% | + 5% | $1.33 | $1.16 | – 13% Discount = “bad” |
Notwithstanding that the LIC at a discount is maligned it does not take a rocket scientist to see which LIC was the better performer. Thankfully increased attention is being directed towards the actual underlying investment performance.
Identifying swings and themes
Researchers are also now producing material that shows trends that can identify swings that may have unfairly penalised a LIC, and also tailwinds that are turning in their favour.
An example is demonstrated in this chart also produced by Bell Potter which weights all LICs collectively. Observers of this chart a year ago saw extreme discounts in LICs and subsequently bought into them. Even now they collectively represent deeper value than during most of the last 5 years.
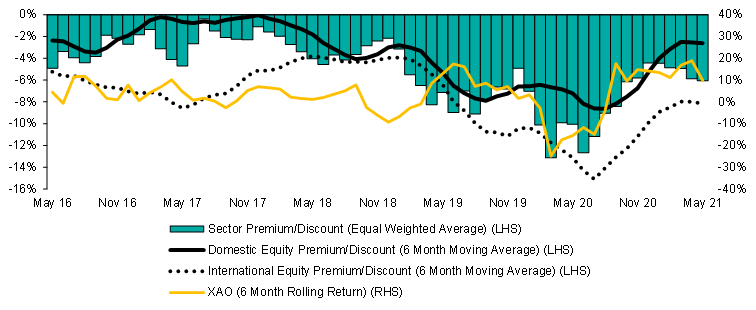
Chart 3: Source Bell Potter. Sector Premium/Discount Tracker
Set the big sails!
In what is certain to be a game-changer for the industry is the entrance of a new LIC with a large investment pool that will invest in well-performing LICs that are trading at unreasonable discounts. This fund will act as a tool to tighten discounts in LICs, including those it does not even invest in. This is because others will simply appear cheaper and any value will be more apparent to the market. Investors will be pouring over their underlying performance to buy oversold LICs and “get ahead” of some of these tailwinds if nothing else.
A change is happening in the conversation
With this structural change, LIC researchers now have no option but to be objective towards strong performing LICs that are at unreasonable Discounts and Premiums.
Patience
The keyword in the conversation about realising value is patience and as Warren Buffet says “the stock market is a device for transferring money from the impatient to the patient”. The dialogue with LICs may now shift to being about historic performance, the opportunity available, and that investors should be prepared to pay a realistic price to buy future performance.
We can expect a larger number of LIC investors will inspect the investment performance of GFL to identify whether it presents a buying opportunity. While past performance is no predictor of future returns it does indicate the skill and competency of the fund manager. Charts 4 and 5 show the performance generated by the underlying GFL investment portfolio and demonstrates the success of the investment strategy and skill of the investment management team that has generated strong performance and outperformance.
UNDERLYING PORTFOLIO PERFORMANCE (as of 31 May 2021)
| 3 months | 1 year | 3 years p.a. | 5 years p.a. | 10 years p.a. | Since Inception (1 May 2006) p.a. | |
| Portfolio | 16.6% | 33.1% | 14.0% | 13.3% | 14.8% | 8.7% |
| ASX All Ordinaries Accum. Index | 7.9% | 30.0% | 10.4% | 10.5% | 8.9% | 6.7% |
| MSCI Index (AUD) | 8.7% | 19.5% | 11.6% | 10.7% | 11.7% | 5.1% |
| Gross performance before the impact of fees, taxes, and charges. Past performance no predictor of future returns | ||||||
Chart 4: Source: EC Pohl & Co Pty Ltd
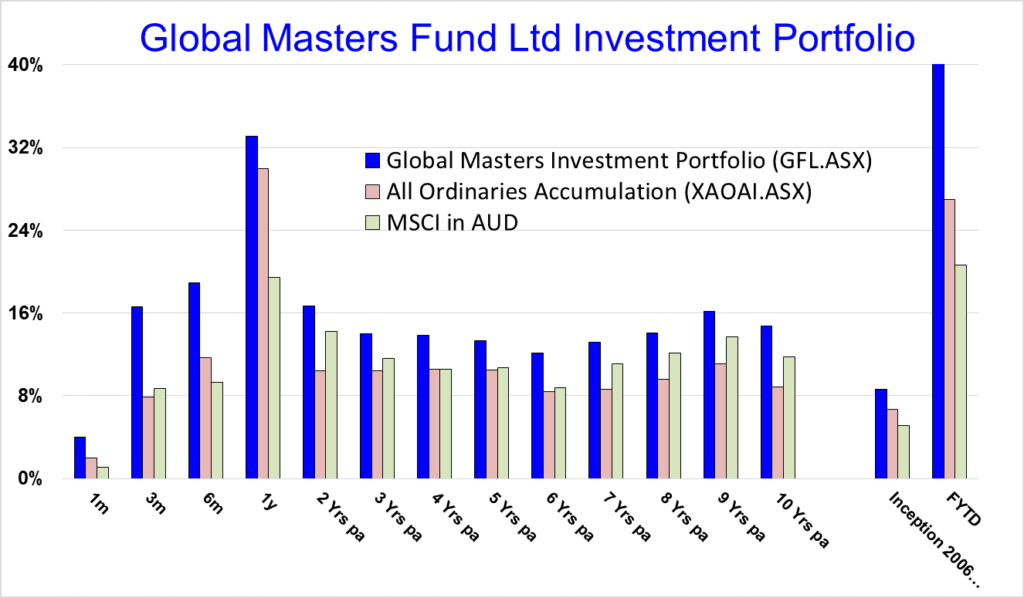
Chart 5: Source: EC Pohl & Co Pty Ltd
That the Investment Manager of GFL does not charge the Company a management fee or performance fee for ~80% of the portfolio* will also become more widely recognised by these investors noting that this significantly reduces cost drag to the future performance generated.
Catching the tailwinds
The key to finding tomorrow’s strong performers is- unsurprisingly- to know your LIC. By that we mean; what has its underlying performance been, has it been sold a little deeper than it should have, is it likely to catch the market attention and are you able to buy that performance at a fair price?
Notwithstanding how individual LICs perform on an NTA and a share price basis patient investors in good LICs such as Global Master Fund, sitting on some dormant value could be ready to catch – or get ahead of – these tailwinds to add some extra alpha to their portfolio’s performance.
* Note – there is a management fee paid on the active management of the UK portfolio, as well as a performance fee payable on the UK Portfolio outperformance of the FTSE.
Important Note and Disclaimer
This article is provided for educational purposes only and should not be considered as financial advice or an indication of future performance of the investment portfolio or company. Please consult professional advice before making any investment decisions.
Global Masters Fund Limited is a unique ASX-listed invested company with principal investments in Berkshire Hathaway in the US and other Global Investments.